"Please click on the chart to zoom in"
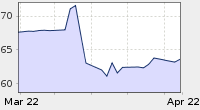
The blue lines show the down trend channel. I expect to see the acceleration rates of decline in coming weeks. The 20 EMA acted as support today ,but I doubt it could hold any more. the 880 support has been hit several times it's about time to break it. I expecting 50 & 90 EMA to act as short term supports in coming days.