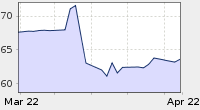
92% of NYSE stocks are above the 50 SMA , that from technical perspective is very bullish, but here is the other side the coin:
As you see in the graph, last time indices became so bullish was back in January which they dropped in average of 30%. Considering the rally base on pure technical with no real change in fundamentals made me more than ever suspicious. Bulls might argue that the ISM index became "less bad" or the housing price show lower rates of decline, but they close their eyes the most important data such as -35% drops in corporate earning, -6.1% GDP or 8.1% unemployment. On Friday we are going to get the employment situation data.
I need to remind my readers that the employment situation did not show any improvements. Analysts are expecting 8.5 % to 8.9 % for April.
Unemployment Rate:
Dec 6.7%
Jan 7.2%
Feb 7.6%
Mar 8.1%
Apr ? (8.5 % to 8.9 %)

Every Thursday at 8:30AM we get the weekly jobless claims; if the number of claims stay above 600K we are going to end up with +9.7% unemployment by end of this year and economy will deteriorate much faster than many investors' beliefs.
Weekly jobless claim shows decline in rate of deterioration

Indices formed a tight upward channel. we could continue to move higher until S&P500 hits the 200 SMA -EMA then head lower. If S&P500 stays above 950 for a week or so it could shoot higher. Please see my post "S&P500 Possible Moves in May. "http://the-us-microeconomics.blogspot.com/2009/05/s-possible-moves-in-may.html"

As I said in my previous posts +30% rally with no pull back, could not be sustain it's smart to be alert and use stop lost, because if this house of cards fall apart there will be no returning point.